Leader Board

The Microsoft Dynamics AX Report Definition Customization Extension (RDCE)

The Microsoft Dynamics AX Report Definition Customization Extension (RDCE) is a reporting Framework component introduced in Microsoft Dynamics AX 2012. It is internal to the reporting framework and is not directly accessible outside the framework. This component enables the reporting framework to provide run-time design alterations based on Microsoft Dynamics AX metadata and security policies. Dynamic transformation of RDL is needed for the following set of actions:

· Hide columns in reports if a user does not have access to those columns

· React to metadata changes in Microsoft Dynamics AX

· Use Microsoft Dynamics AX labels in reports

· Automatically flip designs for Microsoft Dynamics AX languages such as Arabic and Hebrew, which require right-to-left (RTL) layouts

A typical reason for hiding a column is security. In Microsoft Dynamics AX 2009, if a user didn’t have access to a column, the data was not presented in the report but the column still appeared in the report (see Figure 9-9). This behavior is inconsistent with the legacy MorphX reporting framework and does not provide the ideal user experience.

clip_image001

In contrast, Microsoft Dynamics AX 2012 goes a step further and completely removes the column from the report design (see Figure 9-10). This is accomplished by means of the rendering extensions supplied by the reporting framework.

clip_image002

A number of features in Microsoft Dynamics AX 2012 require transformation of the RDL as part of the run-time processing. Conceptually, they are broken apart into separate RDL transformations; however, their implementation may be organized differently than the five discrete units shown in Table 9-1.

clip_image003

Disable the rendering extensions

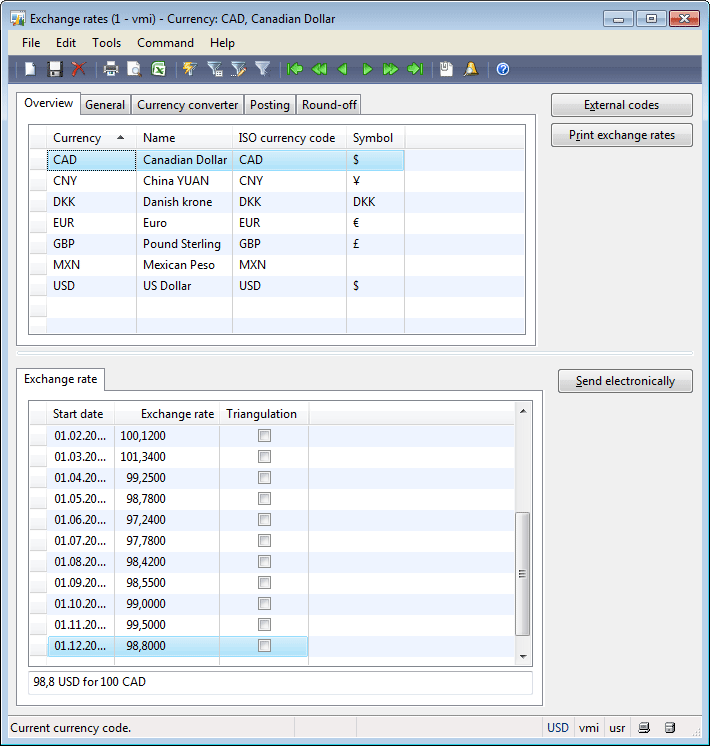
Many reporting scenarios do not rely on run-time design alterations based on user context information; instead, they require fast performance because of their scale. This is the case for most document-based reports, such as those listing customer and vendor invoices, purchase packing slips, and checks. Although the overhead of dynamic formatting of report designs is barely noticeable in an interactive session, it may become an issue in bulk operations where a large number of reports are requested as part of a batch operation. The Microsoft Dynamics AX reporting framework includes a control in the Report Deployment Settings form (Tools > Business Intelligence Tools > Report Deployment Settings) that disables the custom rendering extensions for specific report designs. This setting is highly recommended for any large-scale transactional reports that run in batch operations and don’t require run-time design alterations.

If you select the Use Static Report Design check box in the Report Deployment Settings form, Microsoft Dynamics AX produces language-specific versions of the report design with labels and column sets fully resolved. This occurs the next time that the report is deployed to the report server. These reports are called static RDL reports. The Microsoft Dynamics AX reporting framework automatically uses the design that is appropriate given the context of the user running the report.

However, no additional design alterations are performed when the report is invoked by the user. To make the report dynamic again, clear the Use Static Report Design check box or delete the entry in the Report Deployment Settings form.

Data processing extensions

Data processing extensions are used to query a data source and return a flattened row set. SSRS uses different extensions to interact with different types of data sources. A data source is simply the source of data for one or more reports. Data sources may be bound to Microsoft Dynamics AX or external databases, depending on the unique requirements of your reporting solution. Furthermore, you can display and interact with information from multiple data sources in a single report. Table 9-2 lists the types of data sources supported by the Microsoft Dynamics AX reporting framework.

clip_image004

Imparted From Inside Dynamics AX 2012 Book

Features of Dynamics AX Reporting Project template

The Microsoft Dynamics AX reporting tools also include a new Visual Studio project template
called Microsoft Dynamics AX Reporting Project. This new project type simplifies the process of
creating
SSRS reports that bind to data in Microsoft Dynamics AX.
The Dynamics AX Reporting Project template has the following features:
■ It allows a report to retrieve Microsoft Dynamics AX data from the AOS by using either a Microsoft Dynamics AX query or a Report Data Provider object.
■ It defines the report parameters and layout of the controls.
■ It uses references to Microsoft Dynamics AX labels to produce localized strings based on the
user’s current Microsoft Dynamics AX language.
■ It allows SSRS reports to be created and modified in the Application Object Tree (AOT).
■ It can be used to deploy report customizations to the report server.


Imparted From Inside Dynamics AX 2012 Book

Financial Consolidations - Dynamics Ax 2009 (Part 1)

Financial Consolidations process:

3 steps to perform consolidation in Microsoft Dynamics Ax 2009.

I ) Consolidation company setup

II) Subsidiary company setup

III) Perform consolidation

I) Consolidation company setup:

Consolidation company creation: Consolidation designated company will not be available for any operational process except having consolidation entries posted in here.

Path: Dynamics Ax > Administration > Common Forms > Company accounts

clip_image002

GL Parameters setup:

Path: Dynamics Ax > General Ledger > Setup > Parameters > Ledger tab

clip_image003

Set value "Consolidated company accounts ' = True

System account:

Path: Dynamics Ax > General Ledger > Setup > Posting > System accounts

1. Balance account for consolidation differences

2. Profit & loss account for consolidation differences

clip_image004

Currency and Exchange Rates:

Path: Dynamics Ax > General Ledger > Setup > Exchange rates > Consolidate tab

clip_image005

The Exchange rates form displays an additional tab, Consolidate, when you select the consolidated company accounts field in the General ledger Parameters form. Closing rate field is used for balance sheet accounts and the value in the Average rate field is used for profit and loss accounts. Add exchange rates for each currency and specify 'Closing rate' & 'Average rate' for all currencies in this form (Overview tab will display all currencies, specify exchange rates & select each one of them and click Consolidate tab and consolidation rates).

Chart of Accounts:

Path: Dynamics Ax > General Ledger > Common Forms > Chart of accounts details

clip_image006

3. Closing (or) Average: Use Closing or Average options for utilizing rates specified in 'Consolidate tab' of the exchange rates form.

4. Historical : Use Historical to utilize exchange rates specified in the setup.

This process completes consolidation company setup for consolidations in Dynamics Ax 2009.

II) Subsidiary Company:

The subsidiary setup depends on chart of accounts setup, so following are possible alternative options.

Chart of Accounts Option 1: Identical Chart of Accounts

When this is the situation, the Consolidation account field is selected in the Consolidate Online form during the consolidation process to transfer the balances to the correct accounts.

Chart of Accounts Option 2: No Consolidated Chart of Accounts

In this scenario consolidated company does not have chart of accounts, here two alternatives to perform consolidation.

5. Enter a manual mapping on the Chart of Accounts in the subsidiary. This causes the mapped accounts to create automatically.

6. Do not enter any mapping. This causes the Chart of Accounts to be created in the consolidated company when data transfers from the subsidiary.

Note: This method is not appropriate for consolidation of a foreign currency subsidiary because conversion principles cannot be applied.

Chart of Accounts Option 3: Different Chart of Accounts

Having different chart of accounts in subsidiary & consolidated companies must be mapped to the consolidated company.

Map Chart of Accounts: (This process should be done for all subsidiary companies)

Path: Dynamics Ax > General Ledger > Common Forms > Chart of account details

clip_image007

Map Dimensions: (This process should be done for all subsidiary companies chart of accounts)

Path: Dynamics Ax > General Ledger > Common Forms > Dimensions

clip_image008

This completes subsidiary company setup and Consolidations. Please refer 'Financial Consolidations - Dynamics Ax 2009 (Part 2)' for next steps.

Note: This article has divided into 2 parts as first part describes about setup of consolidation & subsidiary companies and part 2 does contains 'Perform Consolidation' steps.

Currency Setup in Dynamics AX 2009

  1. Create currencies in Dynamics AX
  2. Currency setup in General Ledger module
  3. Setting company default currency


Create currencies in Dynamics AX

To create currency go to General Ledger > Setup > Exchange Rates. The Exchange rates form opens.

Exchange rates form

Exchange rates form

As you can see in above screen shot we have five tabs on this form. First is the Overview tab. In this tab we’ll create new currency. To create new currency press Ctrl + N, in the Currency field write new currency short name (3 characters limit), in the Name field write descriptive name for new currency, in the ISO field select ISO currency code for new currency and in the Symbol field enter symbol for new currency created.

In the lower pane of the Exchange rates form, are the exchange rates for currency. You can define exchange rates for each day. If you want to use one exchange rate leave the Start date field blank. AX will automatically use last exchange rate, if multiple exchange rates are available.

Next is the General tab which shows same information as in the Overview tab except the Gender field (Optional if you are not using Spanish check).

Third tab is the Currency convertor tab. Enable currency conversion by check mark on the Conversion field. Postfix and prefix are character you want to add before and after amount. Enter spaces before and after postfix and prefix fields to separate from amount.

I have created the Pakistan Rupees (PKR) with the following setup:

Exchange rates form, Currency converter tab

Exchange rates form, Currency converter tab

Now I want to view all my amounts in the PRK currency. To do this click the current currency icon located in the bottom right corner of the status bar.

Currency converter

Currency converter

The Currency converter form opens. Double click on the PKR currency.

After doing above setting we will get the following result in the Chart of Accounts form.

Chart of accounts form

Chart of accounts form

The Posting tab define Realized loss, Realized profit, Unrealized loss, Unrealized profit general ledger accounts due to currency exchange rate.

Exchange rates form, Posting tab

Exchange rates form, Posting tab

These settings depend on your company policies and weather you are using foreign currency for billing and payments. There’s a detail article about Realized and Unrealized profit and loss.

Last tab is the Round-off tab as the name shows it’s about rounding off currency.

Exchange rates form, Round-off tab

Exchange rates form, Round-off tab

General rounding-off applies to all modules and there are separate settings for Account Receivable, Account Payables modules and Prices.

Example: We have amount 6827.28. Below table describe how Round Off and Rounding form works.


Rounding form

Round off .01

Round off .10

Round off 1.00

Round off 10.00

Round off 100.00

Normal

6827.28

6827.20

6827.00

6830.00

6800.00

Upward

6827.28

6827.30

6828.00

6830.00

6800.00

Downward

6827.28

6827.20

6827.00

6820.00

6800.00

Currency setup in General Ledger module

In General Ledger module go to Setup > Parameters. The General ledger parameters form opens. Go to the Ledger tab:

General ledger parameters form

General ledger parameters form

In the Express exchange rate field specify how much of your currency equals to 100 units of foreign currency. The value is used in the Exchange rates form.

Example: Enter the 50 in the Express exchange rate field. Save parameters. The Exchange rates form will have the following values.

Exchange rates form

Exchange rates form

The Maximum penny difference field contains the maximum difference between debit and credit amount in the voucher. The difference can appear when debit or credit amount is rounded (because debit and credit amount is rounded separately).

The Maximum penny-rounding in the secondary currency field contains the maximum difference between debit and credit amount in the voucher if this amount is recorded in the secondary currency.

Setting up company default currency

To set company default currency do the following:

Go to the Basic > Setup > Company information > Other tab > Currency field group >Currency field

You can select any currency you have created in the Exchange rates form

How to: Group and Order Report Parameters by Using Visual Studio [AX 2012]

This topic describes how to use Visual Studio tools for Microsoft Dynamics AX to group and order report parameters on a parameter form for a report. Parameters are used to limit data retrieved from the data source to only the data needed for the report. When you define a report you will see two kinds of parameters as shown in the following illustration:

Model Editor Screenshot with Parameters

The dataset parameters are in the Parameters node under the dataset. Dataset parameters are the parameters that are generated for that dataset. Report parameters are under the Parameters node at the report level. Report parameters are the parameters that the end-user of the report sees when they run the report. Dataset parameters must reference a report parameter.

The following screenshot illustrates the parameter form that displays when you select the internal account statement report in Microsoft Dynamics AX. The Customers parameter group on the form groups the parameters that are related to customer data. You can also change the order that the parameters and parameter groups display in the form.

Internal account statement report parameter form

Managing Report Parameters

The following sections describe how to add parameter groups, and how to change the order of report parameters or parameter groups.

To add parameter groups

  1. In Model Editor, expand the node for the report that you want to work with.
  2. In Model Editor, right-click the Parameters node for the report, point to Add and then click Parameter group. A new parameter group is added in the Parameters node with a name like ParameterGroup1.
  3. In the Properties window, use the properties as needed for your report. The following table describes the properties for a parameter group:

Property

Description

Caption

The caption displayed for the parameter group. The caption of a parameter group is localizable text. It is a best practice to reference a label ID for the caption text.

Layout direction

The layout direction of the parameters in the parameter group. The options areHorizontal or Vertical.

Name

The name of the parameter group.

  1. Drag report parameters from the Parameters node onto the parameter group. The parameter now displays under the parameter group node.

Note:

If you have a dataset parameter in your report that references the report parameter that you moved to the parameter group, you must update the dataset parameter reference or you will get an error that the Dataset parameter must reference a valid report parameter. The following steps describe how to update the reference to the report parameter.

a. The default naming convention for a report parameter is [DatasetName]_[DatasetParameterName]. In Model Editor, expand the dataset that contains a reference to the report parameter that you added to the parameter group, and then select the dataset parameter.

b. In the Properties window, select the Report parameter drop-down list and then select the report parameter that you added to the parameter group.

  1. Right-click the report design and click Preview to see your changes.

To change the order of report parameters or parameter groups

  1. In Model Editor, expand the node for the report that you want to work with
  2. In Model Editor, expand the Parameters node for the report.
  3. Right-click a parameter or parameter group, and then select a direction to move the element. The options to order parameters or parameter groups are Move to Top, Move Up, Move Down,Move to Bottom, Sort Ascending, and Sort Descending.
  4. Right-click the report design and click Preview to see your changes.

Microsoft Dynamics AX 2012 reporting framework

Imparted from Inside Dynamics AX 2012 book

In the realm of reporting, there are two primary architectures to compare when considering a
solution: client-side and server-side. Briefly stated, client-side reporting uses the power of the client
to carry the bulk of the load when reports are constructed. The MorphX reporting framework is an
example of a client-side reporting solution. For the most part, server requests are made simply to
access the data. Server-side reporting, on the other hand, uses various server resources to aid in the
processing and construction of a report. The Microsoft Dynamics AX 2012 reporting framework is
a server-side reporting solution. As you might expect, there are many trade-offs between the two
models. The next sections discuss some of the benefits and limitations that are associated with
each design.


Client-side reporting solutions
As mentioned earlier, the MorphX framework is a proprietary client-side solution that is fully
integrated into the Microsoft Dynamics AX integrated development environment (IDE). In this model,
reports contain references to data sources that are bound to local Microsoft Dynamics AX tables and
views. They also define the business logic.


image


The key benefits of a client-side reporting solution include the following:
■ Business logic is executed along with the design definition, allowing for programmable
sections in reports.
■ No deployment is needed: you import the report, and it’s immediately available to the client.
■ X++ developers can use familiar tools to construct report designs.
Notable disadvantages of a client-side reporting solution include the following:
■ Client components must be installed for a user to be able to view a report.
■ Users outside the domain, (outside the network boundary shown in Figure 9-1), must connect
to a Microsoft Dynamics AX client through Remote Desktop Connection to access reports.
■ Access is limited to the data that is accessible from the client.
■ Components such as business logic, parameter management, and designs cannot be shared
across reporting solutions.

Server-side reporting solutions
SSRS, the primary reporting platform for Microsoft Dynamics AX, is a server-side reporting solution.
This framework takes advantage of an industry solution that offers comprehensive reporting
functionality for a variety of data sources. This platform includes a complete set of tools that you can
use to create, manage, and deliver reports. With SSRS, you can create interactive, tabular, graphical,
or free-form reports from relational, multidimensional, or XML-based data sources.

image

The key benefits of a server-side reporting solution are as follows:
■ It provides access to external data sources, including SSAS and web services.
■ It supports reporting in thin clients, with no additional client components required. Users
outside the domain (shown as the network boundary in Figure 9-2) can connect to Enterprise
Portal to access reports, instead of having to connect remotely to the Microsoft
Dynamics AX client, as in a client-side reporting solution.
■ The workload for report rendering is performed on the server.
■ Design caching improves the overall performance of report generation.
The key limitations of a server-side reporting solution are as follows:
■ The lack of a direct connection to local printers affects some scaling scenarios.
■ Report modifications must be deployed before they can be accessed by the client.
■ It requires additional server management for system administrators.

Report execution sequence

image

The following list corresponds to the numbered items in Figure 9-3:
1. Menu item An entry point into the report execution sequence. Menu items contain
predefined hyperlinks that are used to instantiate and execute reports. Configuration keys can
be linked to menu items to manage user access.
2. Report definition (.rdl file) An XML representation of an SSRS report definition, containing
both the data retrieval and design layout information for a given report.
3. Application Object Server (AOS) The core of the Microsoft Dynamics AX server platform.
The query web service is used to access OLTP data.
4. Customization extension Design customizations are applied to produce a personalized
view of the report.
5. Report viewer The report is rendered for the user in the client.

AX 2012: Tab control

A tab control is a container control designed to hold separate tab pages, and is a way of grouping a large number of fields on a form so that not all of the controls are visible at any one time, but can be accessed quickly by the user.

Introduction

Prior to Ax 2012, only one style of tab control was available. This displayed the contained tab pages in a traditional horizontal format, with the tabs for accessing each tab page arranged across the top of the tab control.

From Ax 2012 onwards, different styles of tabs became available. These are designed for use in different situations, and the use of each style is dictated by best practice guidelines depending on the form design pattern used.

Tab styles

The following tab styles are available in Dynamics Ax 2012 onwards.

Tabs

This is the traditional horizontal format available in previous versions.

Fast tabs

These are arranged vertically, with collapsible sections. The user can elect to expand as few or as many of the sections at one time as desired, and this decision will be persisted so that next time the form is opened the layout will be identical.

An example of Fast tabs in use from the standard Customer form is shown below. Three tab pages are shown; Payment defaults, Financial dimensions and Invoice and delivery.

FastTabs.jpg

Summary fields

Fast tabs support the use of summary fields, which are a set of horizontally arranged data controls, visible even when the tab page is collapsed, giving a summary of the data presented on the tab. In the screenshot above, summary fields are shown for the Payment defaults and Invoice and delivery tab pages, as highlighted on the right-hand side of the screenshot.

The selection of which controls to display in the summary section is made by the application itself. The system examines each control on the tab page in turn, in the order specified in the form design, and decides whether or not that control qualifies as a summary field.

Each control is either included or excluded, until a maximum of five summary fields are identified or all controls on the tab page have been evaluated. This information is then shown without labels next to the fast tab page caption. It is important the data is self-explanatory.

The criteria used to evaluate each control is as follows:

  • All data form controls are considered for inclusion, except check boxes.
  • Unbound controls are never included.
  • Controls bound to local display methods (at form or datasource level) are never included.
  • Table-bound display methods are also never included, despite it being possible to include them in the AutoSummary field group on the table.
  • If the control is bound to a table field and is not a referenceGroup control, then the following rules apply:
    • if the FastTabSummary property is set to Yes, then it will be included.
    • if the FastTabSummary property set to Auto, then it will be included only if it is in the AutoSummary field group on the underlying datasource table.
    • if the FastTabSummary property is set to No, then it will not be included, even if it is in the AutoSummary field group.
  • If a control is a reference group control, then the individual sub-controls (segments) of the reference group are individually examined. Each will be included in the summary controls if it exists in the AutoSummary field group of the related table.

It is not always possible, on a particular form, to exactly specify which fields will be shown. Specifically, reference group controls will be included based on the contents of the AutoSummary field group on the related table, with no way to override that on the local form.

Vertical tabs

These are used in the Table of Contents form style.

Index tabs

These are similar to the traditional, older-style tabs, except that the tabs themselves are arranged horizontally across the bottom of the control.

Using tabs in X++

Best practice is to override the pageActivated() method on a tab page if code needs to be run when a user selects a specific tab page.

Imparted from here

Model driven development in Dynamics AX

imparted from here


Did you know that Microsoft ships a cool business application that manufacturing and distribution companies use to run their business.

The name of the application is Dynamics AX and Michael will take you inside Dynamics AX to you about the innovative model-driven

architecture that was created to make this application very easy for partners to customize and extend for individual business and country requirements.

WCF and AIF in Dynamics AX 2009

Imparted from here

AIF is a standards-based framework that allows you to publish and consume web services.  It’s used primarily in integration scenarios when connecting Dynamics AX with other systems.  AX also has .NET Business Connector (BC.NET) for integrating with .NET applications.  BC.NET is more for client side integration.  AIF is all about web services and is completely standards-based. Under the covers AIF takes full advantage of .NET using Windows Communication Foundation (WCF).  For more complex integration scenarios AIF can also help expose services using MSMQ and BizTalk.

With Dynamics AX 2009, the team ships a bunch of services (about 60 out of the box) that are ready for use.  That includes, for example, the more common scenarios like integration with sales orders or customers.  AIF allows you to create, read, update and delete those sales orders while maintaining the integrity of the database (i.e. without directly touching the database at all).  This is done independent of the transport so when developing you could begin by updating via http and later switch to MSMQ.  This can be as simple as enabling the service then “generating” which generates the WCF interface (i.e. WSDL).  That web service is then available to be consumed by any standards-based client (including apps written in php, java and naturally any of the languages in Visual Studio).  You can also configure the service endpoints to change the binding or authentication parameters.

In the video, Michael walks us through using a standard Excel Visual Studio Tools for Office (VSTO) project to consume a AX 2009 sales order service that is exposed using AIF.  He also shows us how, by using WS-Addressing in the WCF headers, you can pass a target company for a web service call. By default, AX limits error messages coming back from the server for security reasons.  Michael shows us how to configure AX to propagate those errors when you need to see them.

Dynamics AX is a rich platform for supply chain management and financials.  AIF opens up AX so that ISVs can build on that richness by integrating their own applications.  Sometimes when you do that you need to consume a web service exposed by external applications.  We see here how you can plug external web services into the AX processes.  In this case, Michael shows us how when trying to create a customer in Dynamics AX with a name that has been blacklisted by the US government (“Bin Laden”, for instance.  Yikes!  Smiley ) the customer create process calls out to an external web service in the cloud to verify the customer name.  This seamless integration of external processes is a boon for ISVs that need those deep integration points.  Michael explains how. In order to do this sort of integration you build a Service Reference in the Application Object Tree (AOT) to provide the parameters.  AX takes care of much of work by generating the artifacts (compilation, deploying, bundling etc) that are deployed and executed on the server.  CLR interop is available in order to use .NET DLLs and their classes.

Some code samples are available here:

Upcoming AX2012 Workflow Apps and Features

Enabling Workflow Configurations for different modules


If you have created new workflow templates for modules in Dynamics AX that do not already any, you may wonder how to get the “workflow configurations” option to appear in the that specific module’s menu. Recently a reader provided me with the following method to follow.

1) Navigate via the AOT to Menu Items, Display, WorkflowConfigurationCust.
2) Duplicate the Menu Item and rename it to something appropriate. E.G. WorkflowConfigurationHRM from Human Resources.


3) Change the Menu-Item’s EnumType Property to the module that you would like it to work for. E.G. Human Resources.


4) Drag and drop the Menu Item into the ‘Setup’ menu section of the relevant module’s menu.

Imparted from here

Filtering a DataSet from Code behind

Enterprise portal allows filtering the list pages using the Filter control available on the EP Grid.

The Filter control provides a UI to select the field, criteria and the values you want to filter the grid.

It is also possible to add multiple conditions.

image

But there may be scenarios where you want to use your own controls to filter the grid or the underlying DataSet.

The EP framework provides the following classes to do this –

- FilterObject

- ConditionType

Let’s look at how we can do the filtering from code behind.

1. Add a Filter to list only the Customer whose name that starts with “Light”

clip_image004

2. Using Between operator – Between operator is a special case. There are two ways to use the Between operator -

a. Using – value..value

clip_image006

b. Using – valueCollection class

clip_image008

3. How do I use more than one condition -

clip_image010

4. Filter on a date – which format should a date be in? Is there a single format which can always be used?

When using the Filter control available in EP Grid, the date will be in user regional settings.

But when using from the code behind, the IIS server’s regional settings will be applicable.

So if the regional settings on the IIS are ‘MM/DD/YYYY’ the date value must be specified in ‘MM/DD/YYYY’ format.

clip_image012

Security Permissions Properties for a SSRS Report [AX 2012]

This topic lists and describes the many permission related properties that exist on subnodes under the Permissions node under the SSRS Reports node in the AOT.

SSRS Reports Permissions Node in the AOT

The following list shows the position of the Permissions node under the SSRS Reports node in the AOT:

  • Reports
    • YourSSRSReport
      • Designs
        • RoleCenter
          • Permissions
            • Tables
            • Server Methods
            • Associated Forms

1- Table Properties

This section describes the properties for the AOT node at Reports > YourSSRSReport > Designs > RoleCenter > Permissions > Tables > YourTable.

Property

Required

Description

Table

Yes

The name of the table.

EffectiveAccess

Yes

The permission value. The value can be one of the following:

· Read

· Update

· Create

· Correct

· Delete

· NoAccess

The permission values for the EffectiveAccess property represent a hierarchy. Read is the weakest permission,

and Delete is the strongest. Delete permission includes every other permission. Create permission includes Update and Read.

You can set the permission value to NoAccess to prevent all access to the table.

ManagedBy

Optional

This property is reserved for use by automation tools.

2- Server Method Properties

This section describes the properties for the AOT node at Reports > YourSSRSReport > Designs > RoleCenter > Permissions > Server Methods > YourServerMethod.

Property

Required

Description

Class

Yes

The name of the server class.

Method

Yes

The name of the secure server method tagged with the SysEntryPointAttribute attribute.

EffectiveAccess

Yes

The permission value. The value can be one of the following:

· Invoke. The server method can be called.

· NoAccess. The server method cannot be called.

SystemManaged

Yes

Indicates whether this permission was added through automatic inference. The value can be one of the following:

· Yes. This permission was added through automatic inference.

· No. This permission was created manually.

ManagedBy

Optional

This property is reserved for use by automation tools.

3- Associated Form Properties

This section describes the properties for the AOT node at SSRS Reports > YourSSRSReport > Designs > RoleCenter > Permissions > Associated Forms >YourAssociatedForm.

Property

Required

Description

Form

Yes

The name of the form.

AccessLevel

Yes

The permission value. This field can contain one of the following values:

· Read

· Update

· Create

· Correct

· Delete

· NoAccess

The permission values for the EffectiveAccess property represent a hierarchy. Read is the weakest permission,

and Delete is the strongest. Delete permission includes every other permission.

Create permission includes Update and Read. You can set the permission value to NoAccess to prevent all access to the form.

SystemManaged

Yes

Indicates whether this permission was added through automatic inference. The value can be one of the following:

· Yes. This permission was added through automatic inference.

· No. This permission was created manually.

ManagedBy

Optional

This property is reserved for use by automation tools.

How To SSRS Parameter to Current Month using an SSAS Data Source


Imparted from here

When dealing with report parameters that involve time, I usually like to default the report to the current unit of time used by the report, often month.  When a user views the report in a particular month the parameter will always default to that month, saving the user from having to select it every time.

There are two elements to making this happen.  One is to define the current month in your Time dimension,  and the other is to build the dataset into your report to feed the default for the Time parameters.

1. Define current month in the SSAS Time dimension

I know there is Time functionality built into SSAS cubes, but I still like the flexibility of building attributes into my DIM_Date table in the data warehouse.  In this way it can be used in both cube and SQL queries alike.  I won’t go into details about how the Dim_Date table is created as that is another subject.  The DIM_Date table is rebuilt nightly and an attribute called MonthPeriod identifies whether the date is in Current Month, Previous Month, etc.  You can label any months you like, with your own descriptions.  Some examples are below.

image

The important thing about this attribute is to ensure that MonthPeriodID for the current month is always 0, and the MonthPeriodID for other months is relative to that. So ‘Current Month –1’ is 1, ‘Current Month –2’ will be 2, etc. This way you can build logic into your reports which relies on the fact that, for example, last month has a MonthPeriodID of 1.  It is critically important that the underlying ids belonging to each description are always the same.  If Current Month is 0 today and changes to 10 tomorrow, the defaults in your reports will not work.  SSRS stores the MDX tuple associated with the description and not the actual description. So when you select ‘Current Month’ in step 3 below, SSRS is storing [TIME].[Month Period].&[0] and not the ‘Current Month’ label.

Once you have this attribute defined in your DIM_Date table and it is being updated nightly, add it to the SSAS cube for use in your reports.

2. Build the default dataset into your report to feed the SSRS Parameter.

Background:

When you build the main dataset for the report and add parameters in your dataset,

image

SSRS automatically creates the dataset for the Available Values for the parameter. You can view these hidden datasets used to feed Available Values by right clicking on [Datasets] in the [Report Data] window in SSRS and selecting [Show Hidden Datasets]. 

image

You can view and/or edit any of these hidden datasets.

image

I don’t recommend editing the hidden datasets, since they are created and used by SSRS by default and your changes can sometimes be overwritten if you add additional datasets using the same parameters.  If you wish to customize the Available Values you are better off creating a new dataset with a different name specific to that purpose and then changing Report Parameter Properties to use the new dataset to retrieve the Available Values.

image

Building the Default Dataset

For this particular report the user can choose Year and then Month Of Year.  The same dataset can be used to feed both the default current year and the current month. 

1. Right click on Datasets in the Report Data window and select Add Dataset.

2. Select the Radio Button ‘Use a dataset embedded in my report’.  I like to use Shared Datasets for this type of thing, but for some reason shared datasets used for defaults with an SSAS data source don’t seem to work when published to SharePoint.  So for now just embed it in the report.  Select (or define) the cube you are using as your Data source, and click on the Query Designer button.

image

3. From the TIME dimension drag the ‘Month Period’ attribute defined in Part 1 to the filter area of the Query Designer.  Click in the Filter Expression and select ‘Current Month’. Click OK.

image

4.  Drag Year and Month of Year onto the Query design page.  Right click on the design page and select ‘Include Empty Cells’ so the current attributes will appear when the query is executed.

image

5. Right click in the Calculated Members area and select ‘New Calculated Member’.  From the Metadata pane drag the Year attribute from the TIME dimension into the Expression pane.  Add to the end of the expression “.CurrentMember.UniqueName”.  Give the Calculated Member a name of ‘YearValue’.  Click OK.

image

6. Right click on the new calculated member called YearValue and select Add to Query.

image

7.  Add another calculated member following steps 5 & 6 called MonthOfYearValue. 

image

8. Your dataset now contains the Label and the underlying MDX tuple needed to feed the default time values to your report parameter.

image

9. Click OK to close out of the Query Designer.  Give the dataset a name of DefaultYearMonth. Click OK to save the dataset.

10. Double click the TIMEYear parameter in the Paramaters folder of the Report Data window to edit the Report Parameter Properties. Select the Default Values option. Choose the ‘Get values from a query’ radio button.  In the dataset drop down choose the DefaultYearMonth dataset you created.  In the Value field dropdown select YearValue.

image

11. Do the same as Step 10 for the TIMEMonthOfYear parameter.  Select DefaultYearMonth as the dataset, and MonthOfYearValue for the Value field.

When you preview your report, the parameters will now default to the current year and month.  Going forward the default for the parameter will roll over to whichever month is current.  Users appreciate not having to choose the current month every time they look at a report.

image